
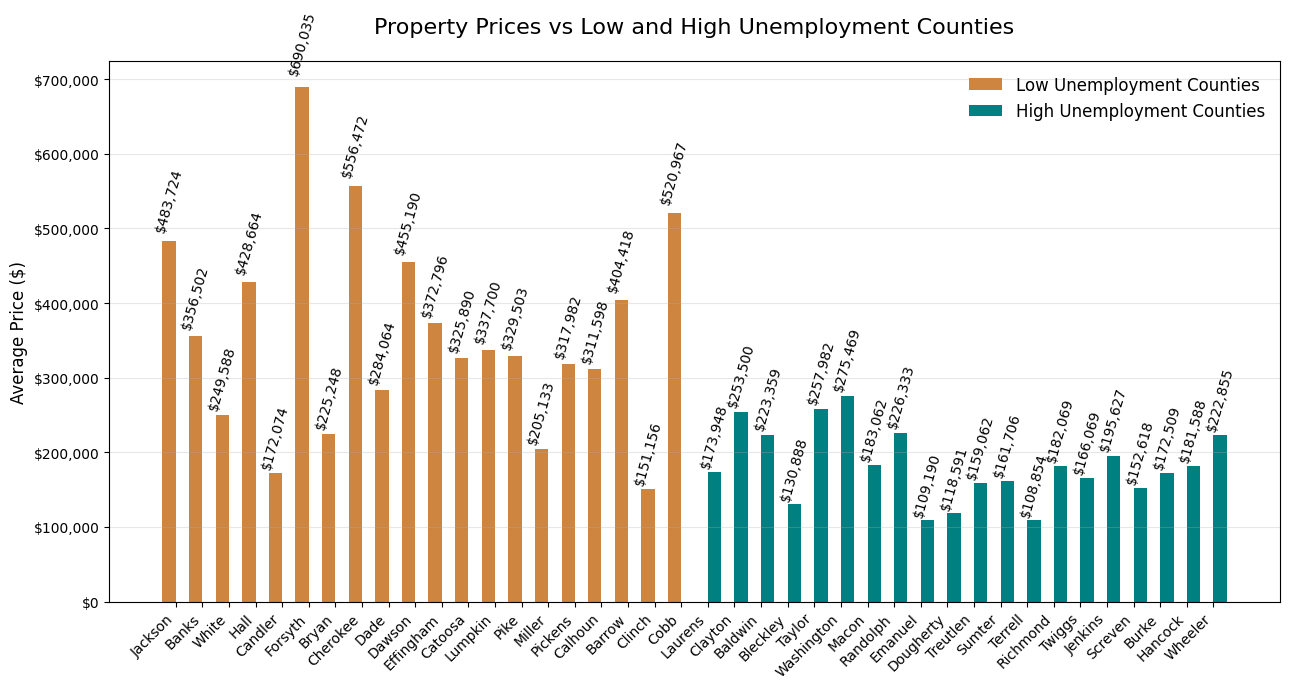
Counties with lower unemployment rates will have higher property values
Methodology
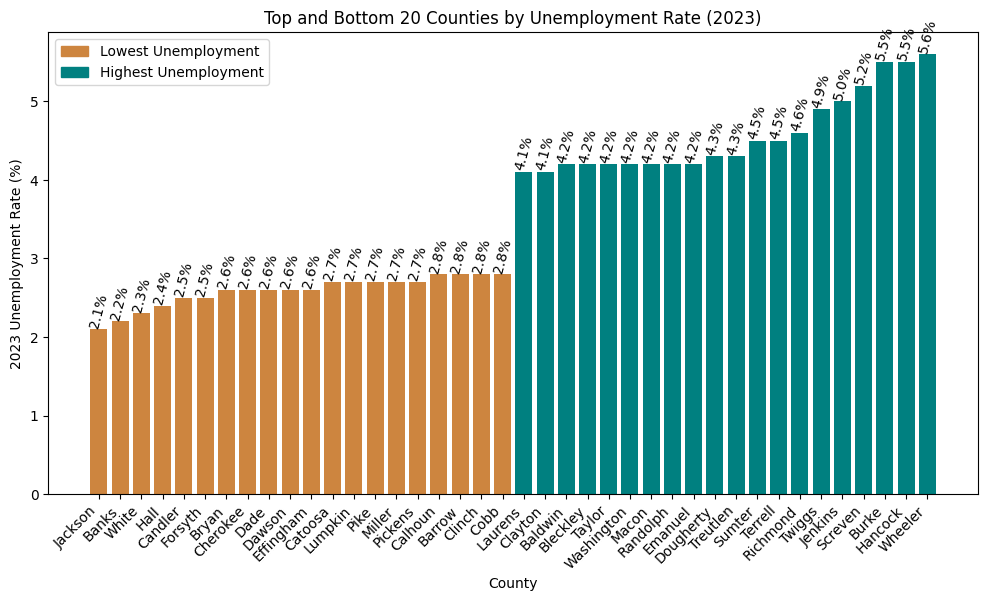
- Filtered unemployment dataset down to top ten and bottom ten for unemployment rates.
- Created bar chart to visualize unemployment rates for these counties.
- Used a bar chart to visualize unemployment rates in these 20 counties.
- Plotted average cost for property in those same counties, using the same color scheme for better readability.