
Counties with a higher number of technical or government jobs will have higher property values
Methodology
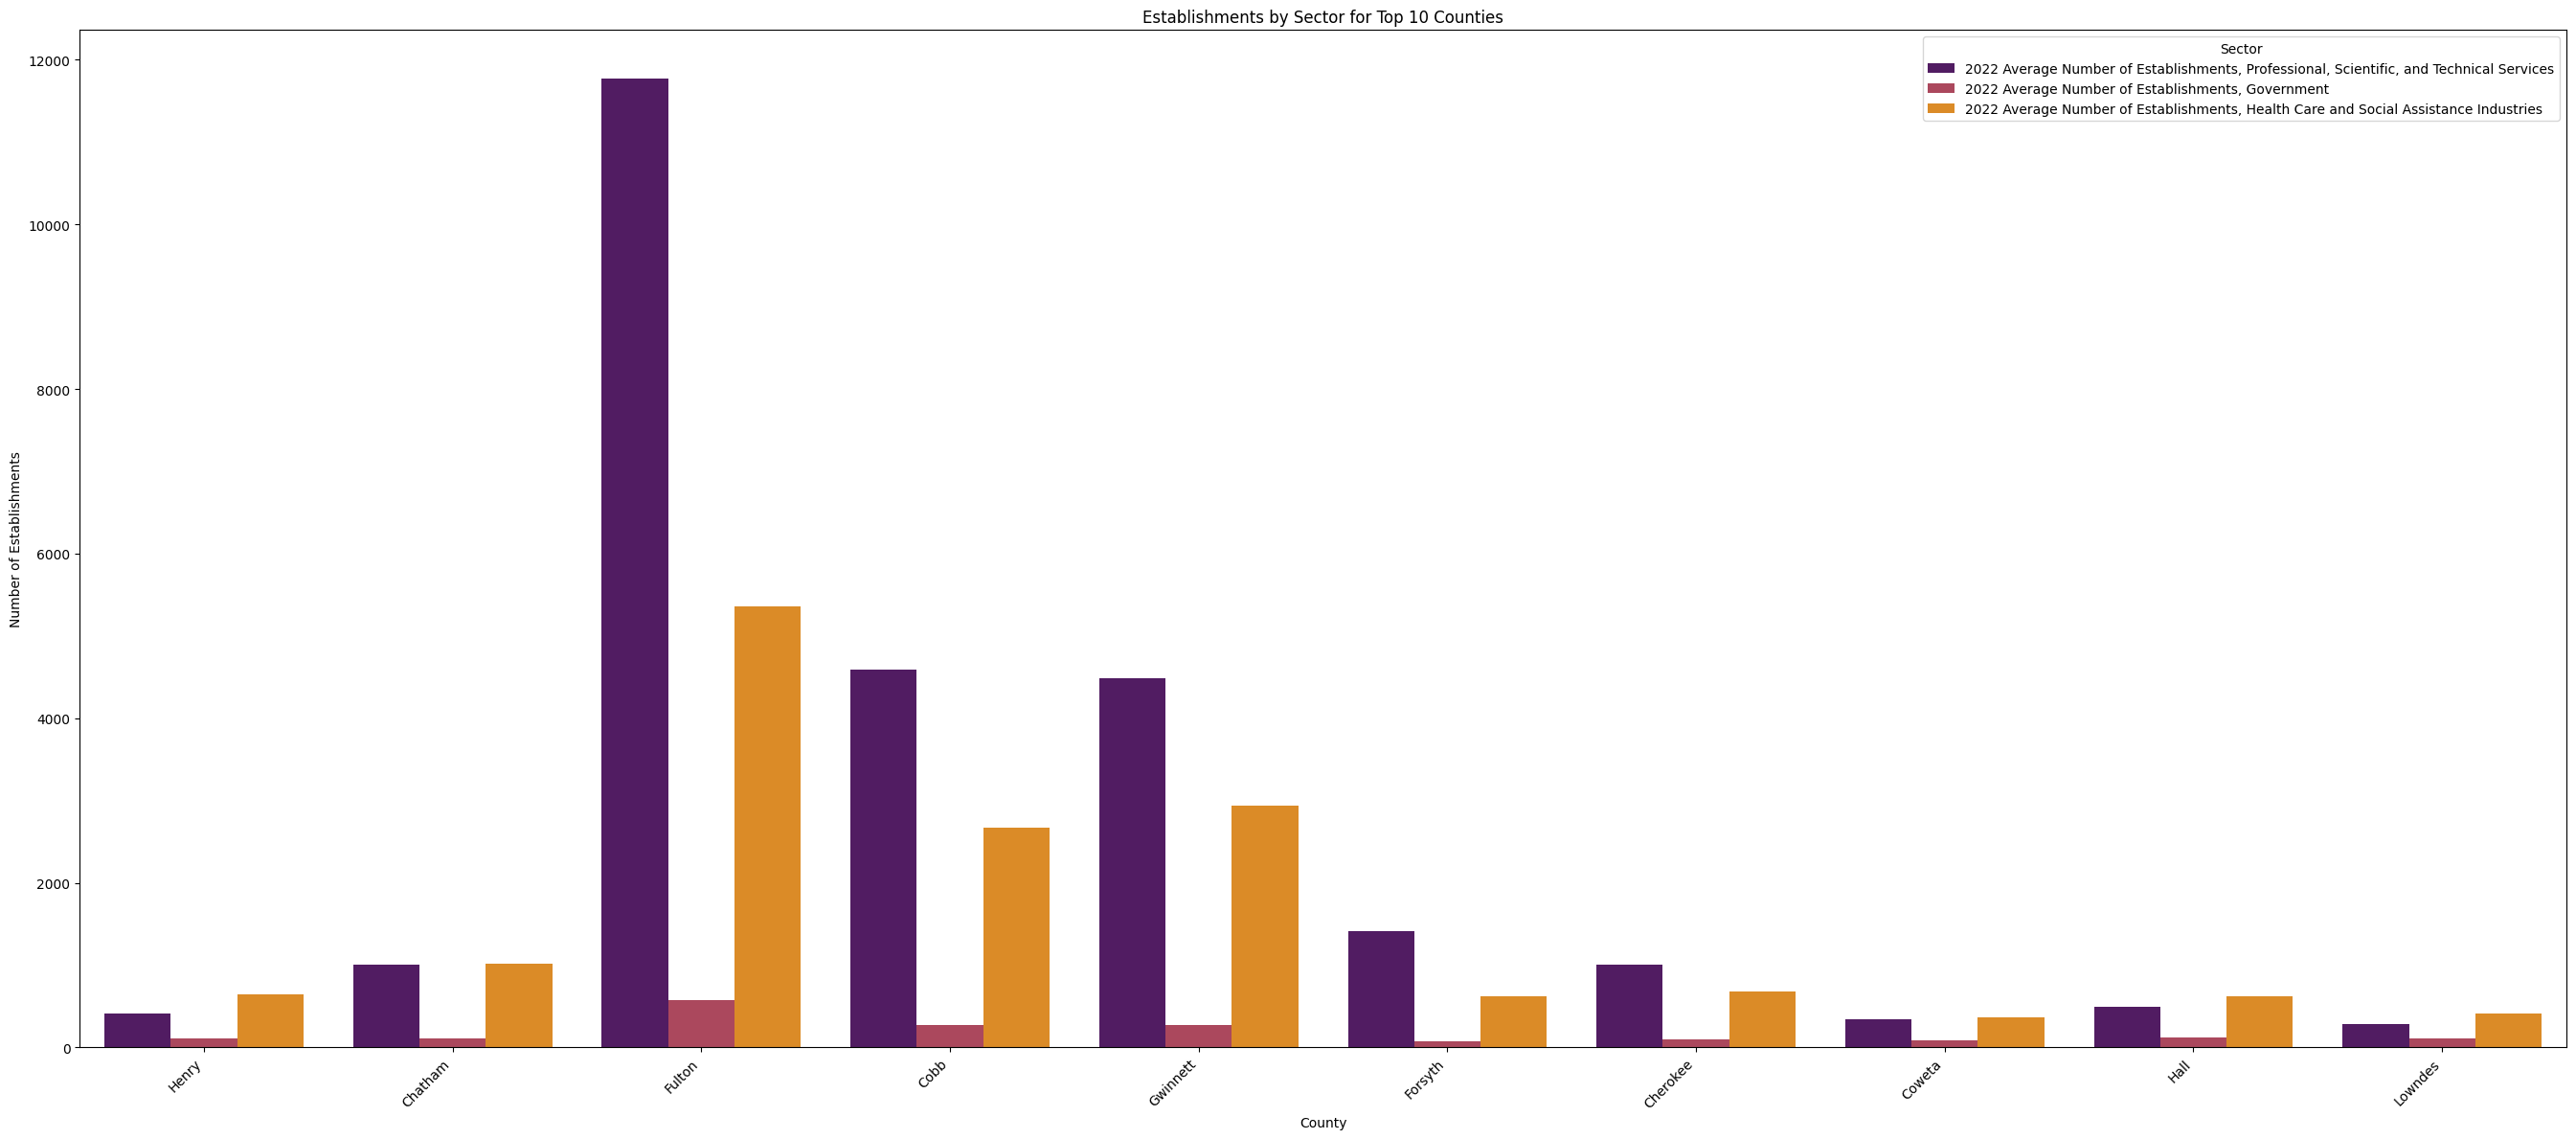
- The first graph shows the number of establishments for each of the top ten counties.
- Purple represents Science and tech establishments. Maroon represents government jobs. Orange represents healthcare establishments.
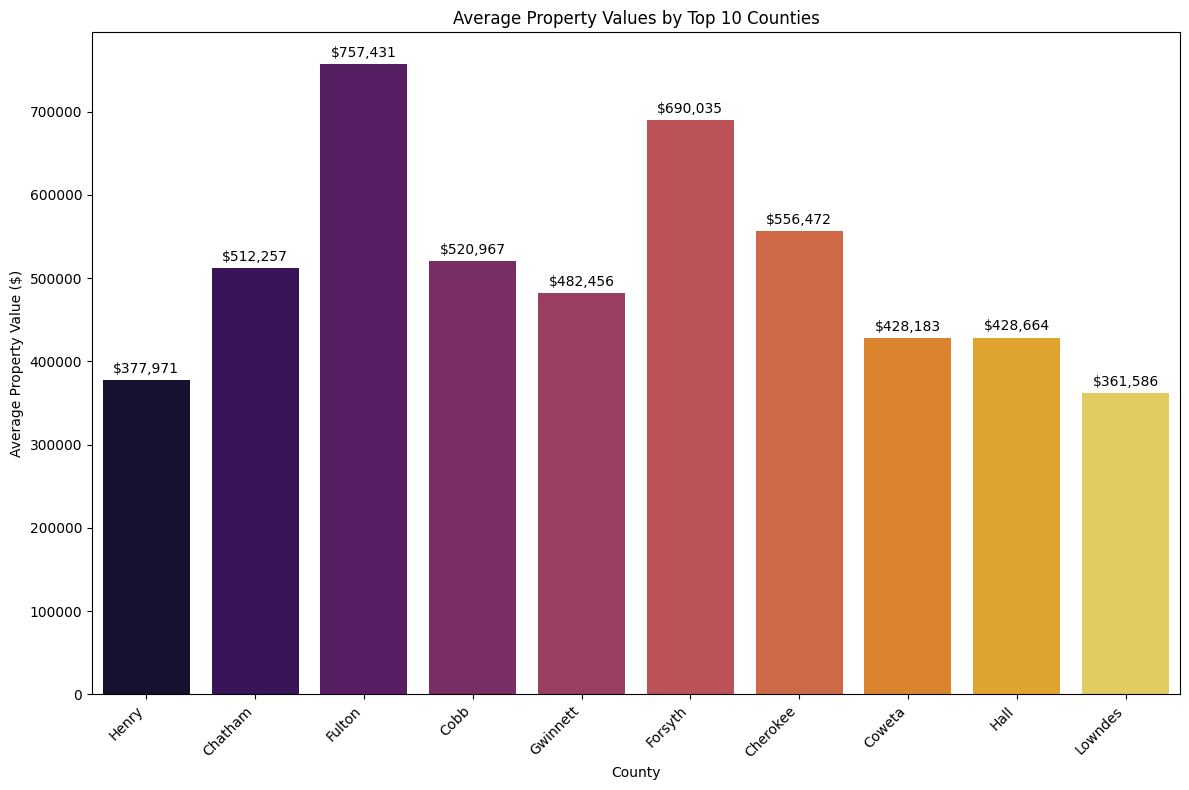
- Created second graph to display average property value per county.