
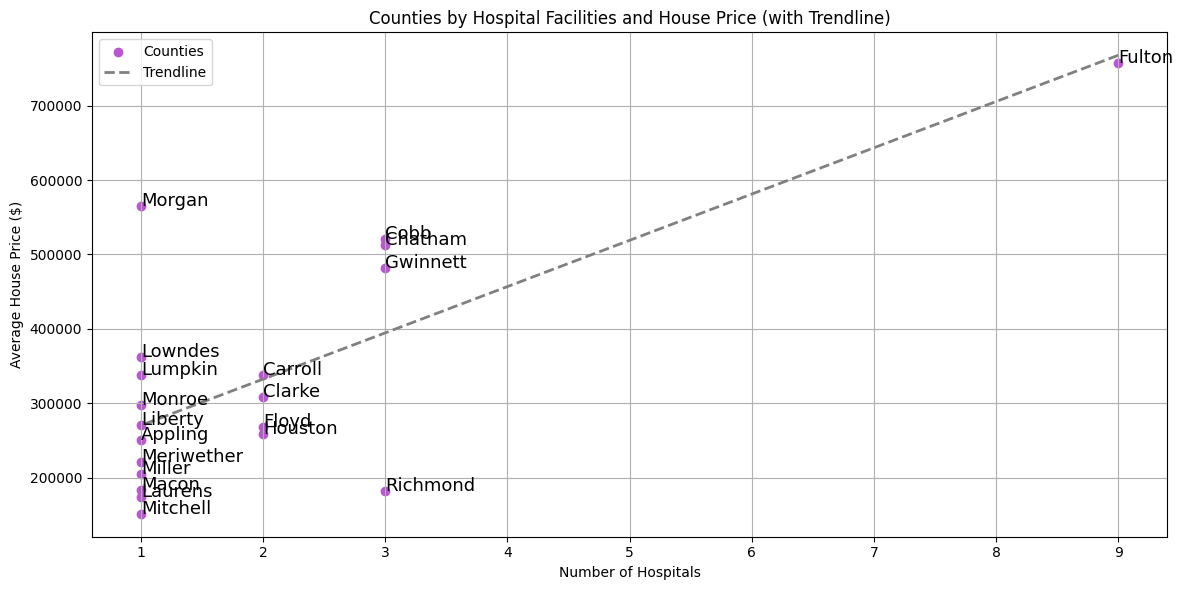
Lower crime and better access to healthcare facilities will result in higher property value
Methodology
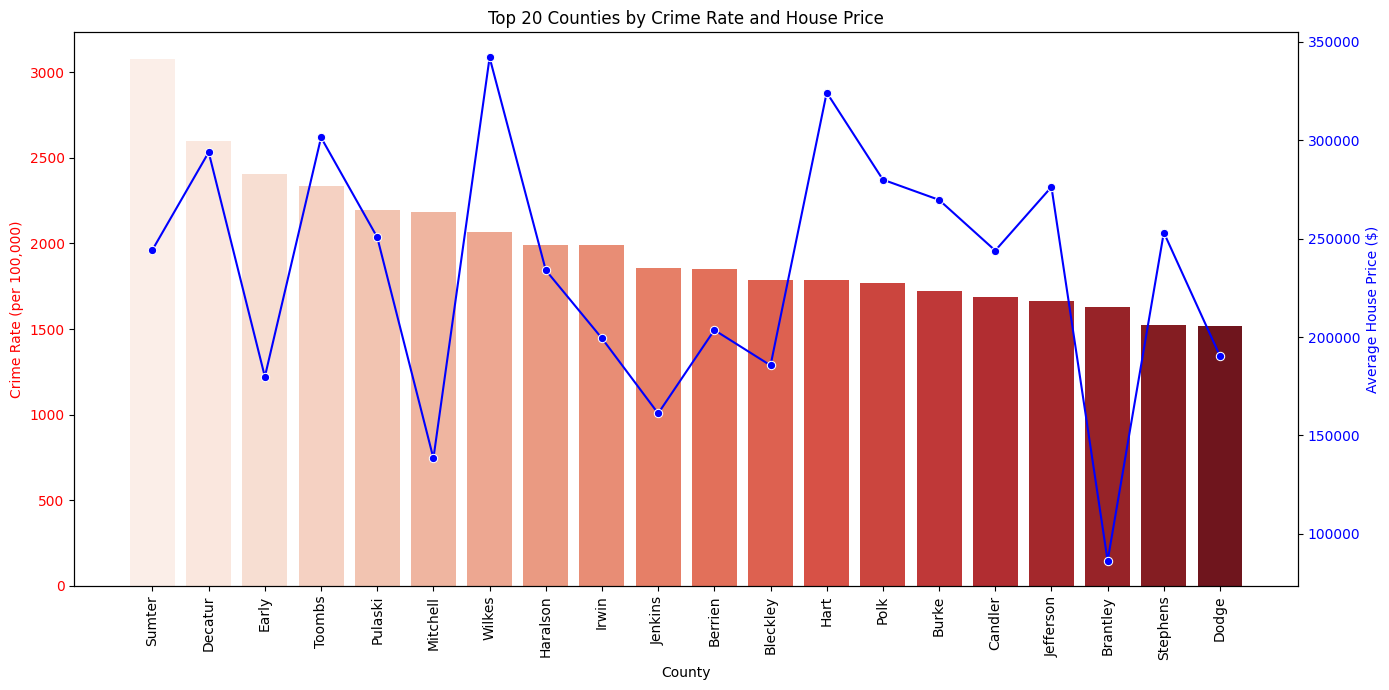
- Created bar chart to graph top crime rate areas
- Added line graph to map average housing price for each county
- For the second graph, created scatter plot to map correlation between counties and number of hospitals per county